Business Insights is powered by the Sisense embedded analytics platform, providing an end-to-end business intelligence solution which allows users to easily explore, visualise and query their data, directly within the Cerillion product suite. Using a combination of dashboards, widgets and dynamic reports, Business Insights provides users with the analytical tools needed to better understand customers and make informed business decisions.
Cerillion Business Insights is an AI-powered embedded analytics platform that unlocks the full value of your customer data by enabling users to easily explore, visualise and query data in real-time.
In highly competitive and rapidly changing markets, a real-time understanding of customer behaviour and business performance is needed in order to make the right business decisions. Back office business support systems contain a wealth of data about user behaviour, preferences, profiles and operational processes. Smart Communications Services Providers (CSPs) who can use this information to take intelligent action will be the winners in the race to reduce churn and maximise revenues from their existing customer base.
Cerillion Business Insights is the means to analyse the Cerillion databases and other related systems, providing CSPs with greater transparency and more ways to engage with their data, leading to faster time to insight, action, and ultimately better business outcomes. It brings together the wealth of business data stored in the Cerillion product suite and surfaces pertinent information in-app within business dashboards, widgets and dynamic reporting, enabling sophisticated data analysis to support CRM initiatives, targeted outbound marketing and revenue assurance programmes.

Key Benefits of Cerillion Business Insights
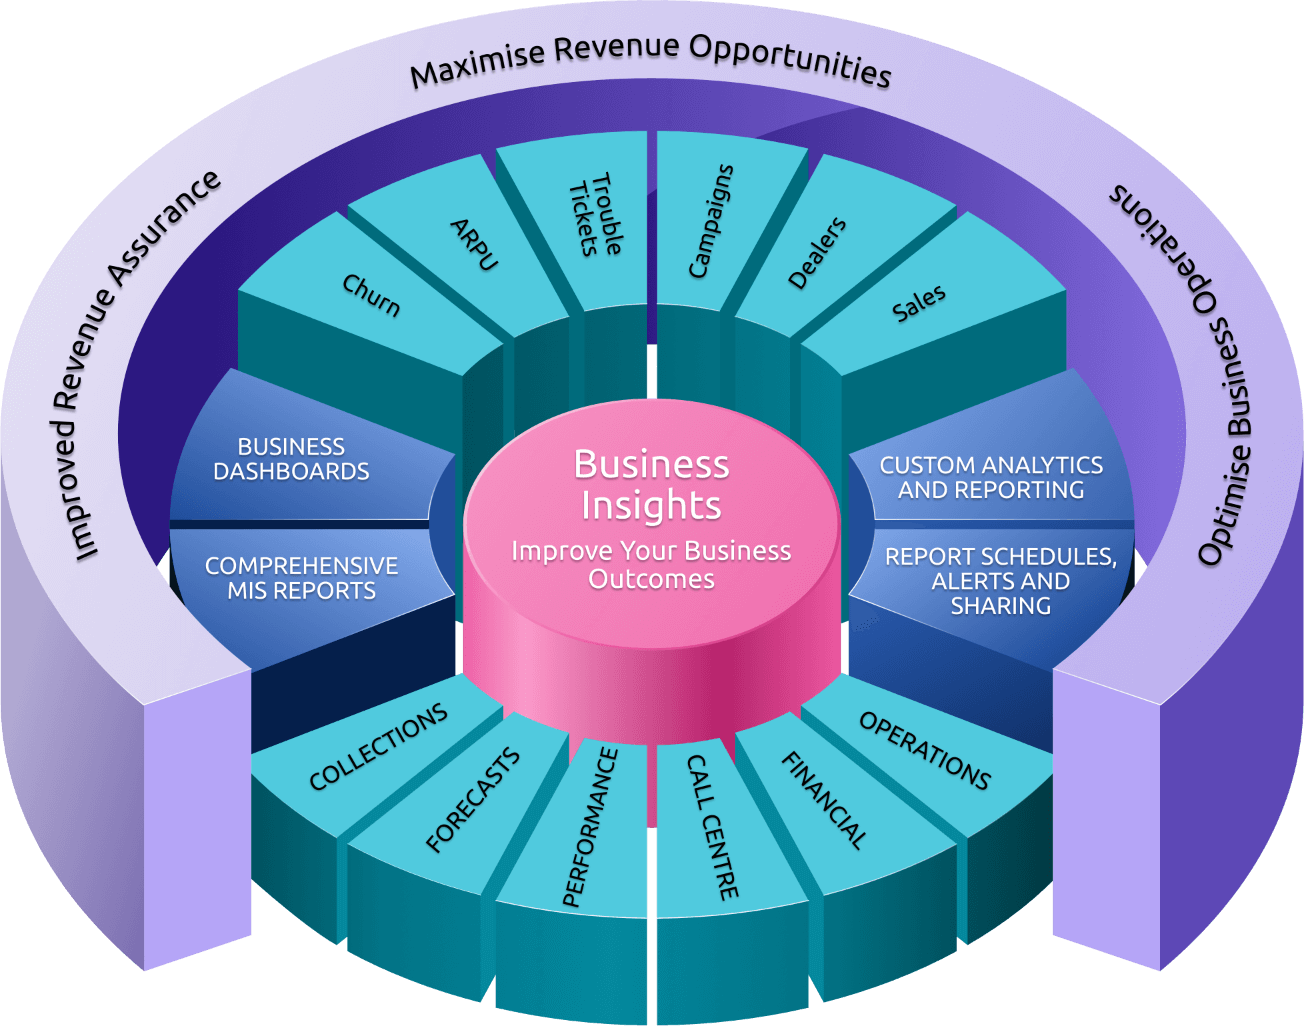
Maximise revenue opportunities
Analyse customer behaviour to identify trends and develop new products and improve services.
Optimise business operations
Bring data to the fore with a set of powerful dashboards and reports to improve your management decision making.
Revenue assurance
Analyse and reconcile end-to-end business processes across the Cerillion suite.
Key Features of Cerillion Business Insights
Best-in-class embedded analytics platform
Business Insights comes with a comprehensive set of customisable dashboards, providing visually engaging insights into business performance with real-time visibility of KPIs across your key functions. All dashboards are fully interactive with dashboard components such as visualisations, filters and drilldowns available to interrogate the data and jump straight to the corresponding entity when action is required. Standard dashboards include Accounts, Sales, Orders, Billing, Credit Control and Inventory.
Cerillion’s core business processes are mapped in a suite of standard reports, developed from years of real-world experience. Reports can be accessed directly within the corresponding product suite module, for example sales, orders and trouble tickets within CRM Plus; billing, payments and collections within Revenue Manager; and so on, providing end users with immediate visibility of key metrics according to their role and function, with drill down access to the underlying system records. These reports can also be further customised by report designers and published for all authorised users.
Customised analytics & reporting
Business Insights delivers a full custom reporting capability using dedicated workspaces to enable business analysts and report designers to build their own reports on the fly based on Sisense ElastiCubes - a smart, suggestive, visual environment that anyone can use and understand, regardless of technical expertise and without the need for scripting or technical mark-up language. Simply drag and drop to join large data sets from Cerillion and other external sources to create one centralised repository of all your data.
Report schedules, alerts and sharing
Whilst the dashboards and dynamic reporting capabilities of Business Insights will bring your data to life, it is the alerts that may make all the difference to your business with real-time notifications on your most important KPIs using dynamic thresholds and advanced machine learning to detect process anomalies. You can also consume insights on the go through any HTML5 compliant browser, and easily share reports and dashboards with colleagues through direct links or in PDF / image format for offline viewing, as well as scheduling for automatic distribution.

